A different look at the periodic table
I am currently reading the book “Sparks of genius” by Robert and Michèle Root-Bernstein. To be honest, I started reading it a few months ago and then I got sidetracked by some other titles, but I am now getting back at it.
The premise of the book is that people are not born creative, but they rather cultivate it, similar to training a muscle group. The authors provide thirteen tools, each one is discussed in a separate chapter, such as recognizing patterns, playing, empathizing and others, and take on examples of creative individuals, such as Albert Einstein, Amadeus Mozart and Virginia Woolf.
In the chapter about pattern recognition, which is very important for any knowledge worker, the example of the periodic table is brought up. Decorating classrooms around the world, the periodic table displays the chemical elements in rows (periods) and columns (groups). This grouping is far from arbitrary though, since it reveals the chemical properties of the elements. Let us take the noble gases, the 18th group of the periodic table, as an example. First of all, they are all in a gas form in room temperature. They also do not undergo chemical reactions with other elements, they are inert. This can be explained by their atomic structure, according to which they all have closed their outermost electron shell.
The breakthrough to get the current form of the periodic table came from Russian chemist Dmitri Mendeleev who envisioned this way of arranging the chemical elements in a dream in 1869.
I saw in a dream a table where all elements fell into place as required. Awakening, I immediately wrote it down on a piece of paper, only in one place did a correction later seem necessary.
— D. Mendeleev, as quoted by Inostrantzev
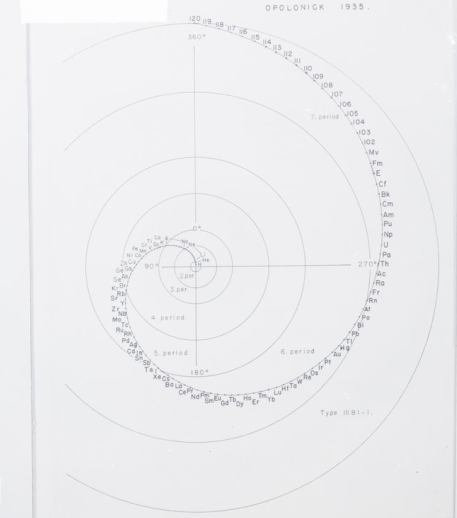
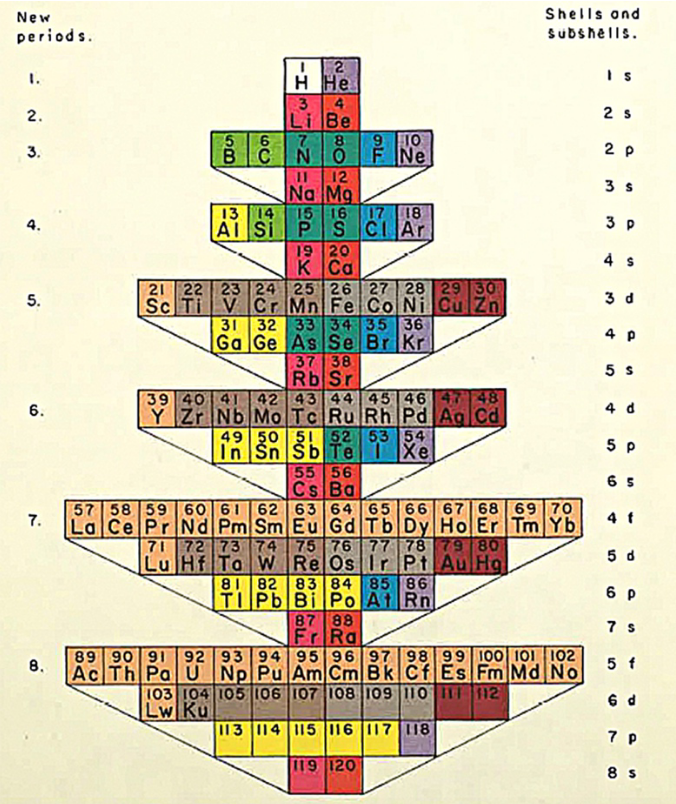
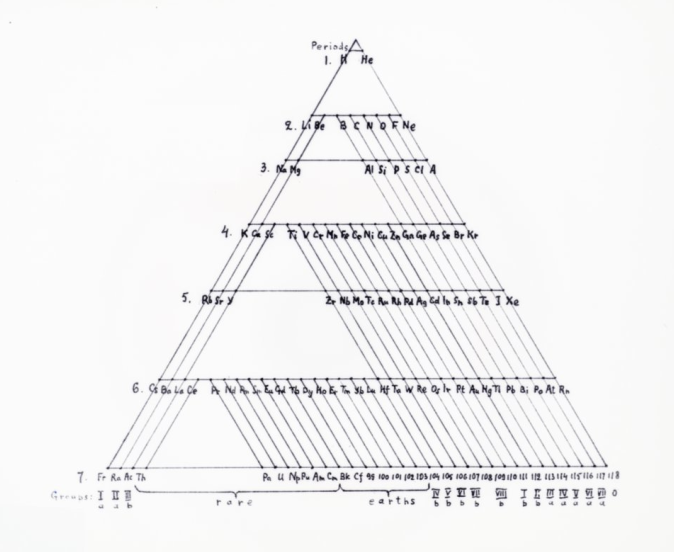
Could a different way of arranging the periodic table provide new insights on Chemistry? There are many different ways of presenting the periodic table, and one of the most well known collections of such periodic systems is the book “Graphic Representations of the Periodic System During One Hundred Years” by chemist Edward Mazurs. Most of the models are available online in the Science History Institute webpage, and I have include few of them in the figures below.


As a nuclear astrophysicist, the way I look at the chemical elements is slightly different, since I am mainly interested in the different isotopes, or versions of the same element. Instead of categorizing them in periods and row, we instead expand the periodic table making a simple two-dimensional graph, where the horizontal axis represents the number of neutrons in an isotope, and the vertical axis the number of protons (different element). There are many nuclear charts like that in the web, such as the National Nuclear Data Center and the Colourful Nuclear Chart. However, I am not familiar with many different representations of the nuclear chart, other than the one I described above. While finishing up my Ph.D., I played around with different ways of depicting the nuclear chart, but did not find anything interesting. A different look on the nuclear chart could provide invaluable insight for nuclear physicists, similarly to the different ways we can arrange the chemical elements in the periodic table. All we need to do is let our minds explore!
